For all those economics professors and tutors out there who struggle to explain the crucial concept of ‘selection bias’, a nice illustration can be found in FIFA World Cup finals records. With students (at least those who do not loathe sport) currently in soccer-crazy mode, they may be more motivated to understand this concept through the following trivia question:
Q: In World Cup (finals) history, which team has the highest goal-scoring ratio (goals scored divided by games played)?
Scroll below for the answer, which may be surprising to many, except the amateur World Cup historians among you.
Most people would instinctively say Brazil; however, they appear second on this list at 2.16 per game (218 from 101 games, inclusive of the second-round of the 2014 edition). Germany follows at a very-close third with 2.15 (221 from 103).
The record-holders are…wait for it…Hungary! Yes, those ‘Mighty Magyars’ top the list and (get this) by a comfortable margin, too – indeed a chasm – their 87 goals in 32 games comes in at an astonishing 2.72 goals per game.
If you don’t believe me (and you’re more than entitled not to), check the figures here. Hungary has never won the World Cup, but have twice reached the final: in 1938, when they lost to Italy; and again in 1954, with legends Puskás and Kocsis (et al.) in their ‘Golden Team’, which came into that World Cup undefeated in more than 4 years, only to squander a two-goal lead (which they had after only 8′) to (the then-West) Germany, who incidentally they had annihilated in the first round by the incredible scoreline of 8-3.
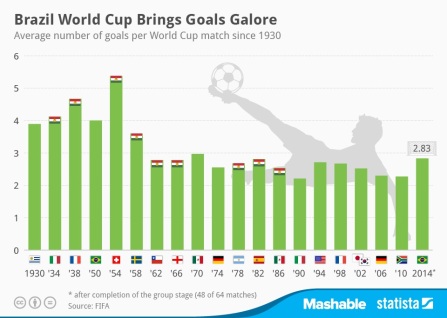
OK, so what is the selection bias here? Well, look at the chart below (from statista), which displays average goals per game by World Cup. The flags I added at the top of the bars denote the World Cup finals that Hungary both entered and qualified for.

From this, it is easy to see that scoring outcomes were lower from 1962 compared to earlier, with a further decline (albeit slight) since then. Hungary is but one of a number of national football teams that were among the best handful in the World for considerable periods at any time since the inaugural World Cup in 1930 (according to retrospective Elo ratings, they were ranked number one as late as 1965). However, of all national teams in this category, Hungary is the one that played the highest proportion of its matches in higher-scoring World Cups.
For all you Magyars out there lamenting your boys’ extended absence from the big stage (28 years now and counting), rest assured that (since it’s unlikely that Brazil and Germany will ever get anywhere near 2.72) the only way to guarantee holding this highly-prestigious record in perpetuity is to continue to NOT qualify for the finals – proof that there is indeed success in failure!
Please note: all future TSE contributions from Liam Lenten will also be cross-posted on his new personal blog, see: http://liamlenten.wordpress.com/

Comments are closed.